[Note: see UPDATE at end of post.]
For reasons unrelated to my usual research, I have been looking into medical literature concerning diabetes in “normal weight” people. If you read anything about treating diabetes the first steps are to eat better, exercise and lose weight. But what if you already eat healthy, exercise a lot and are at a normal or ideal weight? Well, current medical thinking is that if you are at normal weight with diabetes you are more likely to die than someone who is overweight. This seems counter-intuitive which is why it is called an “obesity paradox.”
Much of this comes from a paper published last year in JAMA (a top medical journal) finding that “[a]dults who were normal weight at the time of incident diabetes had higher mortality than adults who are overweight or obese.” This counter-intuitive finding was reported in the New York Times, the NYT health blog, CNN, Rueters, CBS, and many other places.
The study included 2,625 individuals pooled from five observational datasets. The individuals “were classified as normal weight if their BMI was 18.5 to 24.99 or overweight/obese if BMI was 25 or greater.” BMI, or Body Mass Index, is calculated as one’s weight in kilograms divided by one’s height in meters squared.
BMI is the measurement the media uses when reporting, for example, America’s increasing obesity epidemic. BMI is also often used by doctors as an individual measure of health (even though that was never its intended purpose and it has many well-known limitations). One thing to notice is that BMI does not take body composition into account, just weight – one kilogram of muscle counts the same as a kilogram of fat. A common criticism of using BMI for assessing individual health is that a very muscular person is considered as “obese” as a very fat person.
So do diabetic people with normal weight have higher mortality than obese people with diabetes? The results, as quoted, from the JAMA paper:
After adjustment for demographic characteristics and blood pressure, lipid levels, waist circumference, and smoking status, hazard ratios comparing normal-weight participants with overweight/obese participants for total, cardiovascular, and noncardiovascular mortality were 2.08 (95% CI, 1.52-2.85), 1.52 (95% CI, 0.89-2.58), and 2.32 (95% CI, 1.55-3.48), respectively.
Wait a second! They controlled for WAIST CIRCUMFERENCE?!? (I think this may have been the only time I’ve literally done a double-take while reading a scientific paper.)
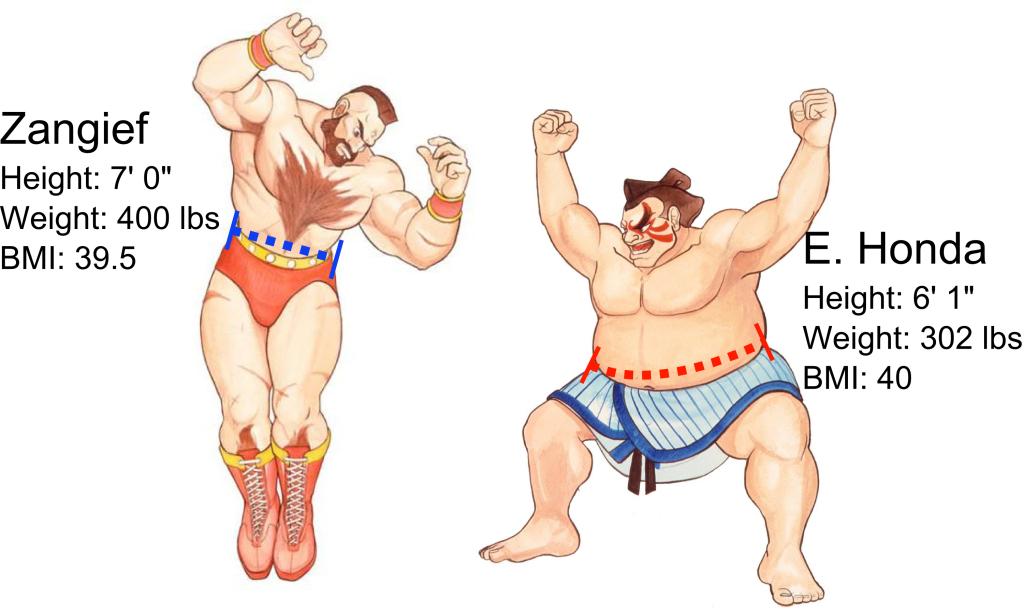
To see why this might be a big problem, please consider two fictional characters, Zangief* and E. Honda, from the hit 1987 arcade game Street Fighter II. These gentlemen have about the same BMI (using the stats from the Street Fighter wiki). However, their waist circumferences are radically different.

Who would you consider more obese? Using BMI alone they are equally obese, but I am also going to go out on a limb and say that E. Honda is closer to what most of us would consider “obese” given that a higher percentage of his mass comes from body fat.** But what happens when we control for waist circumference?
Essentially, we are asking “what is the estimated effect of BMI, discounting the estimated effect of abdominal circumference.” I conservatively estimate that Zangief’s waist is about half the circumference of E. Honda’s. So “controlling” for waist circumference discounts E. Honda’s BMI more and thus we effectively count Zangief as more obese than E. Honda. This is because we have abstracted away the additional abdominal fat that contributes both to E. Honda’s circumference and BMI. The result is that if even if someone built like E. Honda has a higher rate of mortality than someone built like Zangief, we would conclude that less obese people have a higher mortality rate. This “obesity paradox,” though, would just be a statistical artifact of controlling for something we should not have.
But these are video game characters. Would this hold up for real-world data? Let’s see.
R (the statistical software) has an easily downloadable dataset for bodyfat and other body measurements for 253 males. (The documentation suggests that five observations have errors, so I removed them, leaving us with data for 247 males. This is much smaller than the sample in the paper, but good enough to illustrate my point.) For those playing at home, click below for the code to snag the dataset:
#Installs the mfp package - only do this once
install.packages("mfp")

#Load library
library (mfp)

#Load bodyfat dataset
data(bodyfat)

#Copy bodyfat dataset to bf_data
bf_data <- bodyfat

#Add a column of BMIs calculated from weight and height data
bf_data$BMI=703*bf_data$weight/bf_data$height^2

#Remove observations documentation suggests are errors
bf_data <- bf_data[-c(42, 48, 76, 96, 182),]
This data contains body fat percentage (called “brozek”), height and weight (from which we can calculate BMI), and waist circumference. What we are going to do next is a thought experiment where we assume that the common wisdom is exactly true. That is we are going to assume that body fat is an exact predictor for mortality (however measured). In real life this is obviously not true, there will be noise in the data. But this assumption will hurt us in that it should be the hardest case for falsely finding that overweight people have lower mortality than normal weight people. In other words, even assuming that the intuitive result is exactly true, can we erroneously find the counter-intuitive result by controlling for abdominal circumference?
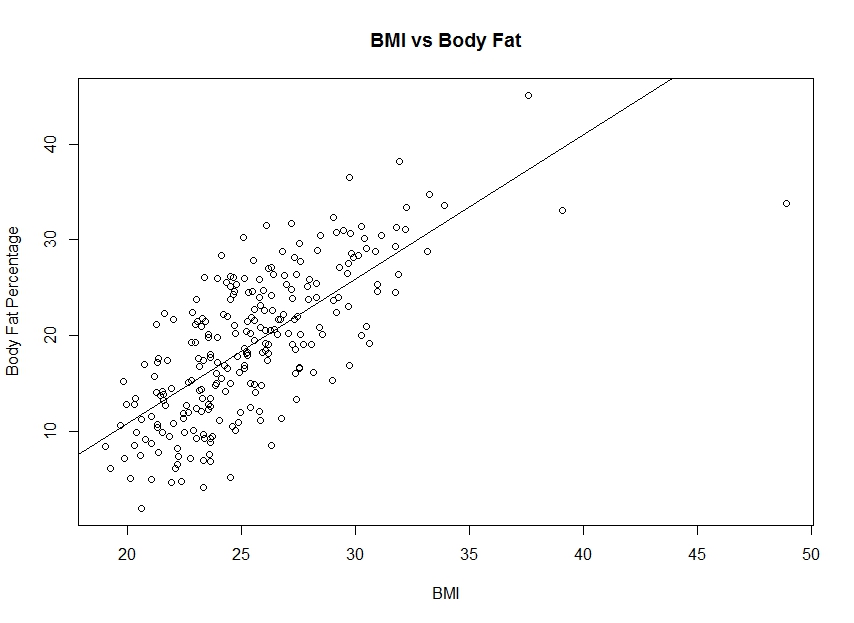
First, lets run a regression of BMI on body fat percentage. If the coefficient of BMI comes out positive, this indicates that there is a positive relationship between BMI and body fat. And, since we assumed that body fat was a perfect predictor of mortality, BMI would have a positive relationship with mortality.
# Fit the regression model (brozek is a measure of body fat percentage)
BMI_fit <- lm(bf_data$brozek ~ bf_data$BMI, data=bf_data)

#Report the coefficients
coefficients(BMI_fit) # model coefficients

#Plot the data and regression line
plot(bf_data$BMI, bf_data$brozek, xlab="BMI", ylab="Body Fat Percentage",main="BMI vs Body Fat")
abline(BMI_fit)
Below are the results. The coefficient for BMI (1.51) is positive, indicating a positive relationship between BMI and mortality. This is consistent with the conventional wisdom.
(Intercept) bf_data$BMI
 -19.393723    1.510123
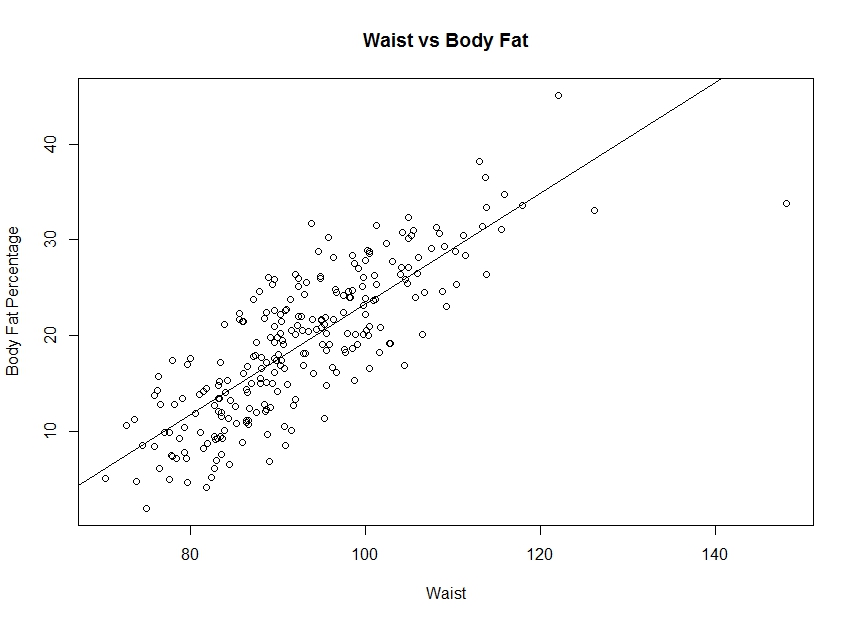
 The same can be done with waist circumference.
# Fit the regression model (brozek is a measure of body fat percentage)
WC_fit <- lm(bf_data$brozek ~ bf_data$abdomen, data=bf_data)
#Report the coefficients
coefficients(WC_fit) # model coefficients

#Plot the data and regression line
plot(bf_data$abdomen, bf_data$brozek, xlab="Waist", ylab="Body Fat Percentage",main="Waist vs Body Fat")
abline(WC_fit)
coefficients(WC_fit) # model coefficients
    (Intercept) bf_data$abdomen
    -34.6493981       0.5791725
 Again, the coefficient for waist circumference (0.58) is positive, indicating a positive relationship between waist circumference and mortality. This is, again, consistent with the conventional wisdom.
Finally, lets see what happens when we run the regression for BMI “controlling” for waist circumference.
# Fit the regression model (brozek is a measure of body fat percentage)
BMI_and_WC_fit <- lm(bf_data$brozek ~ bf_data$BMI + bf_data$abdomen, data=bf_data)
#Report the coefficients
coefficients(BMI_and_WC_fit) # model coefficients
    (Intercept)     bf_data$BMI bf_data$abdomen
    -35.9815548      -0.3732964       0.6960231
The coefficient on BMI came out negative! To a naive observer this would look against the conventional wisdom. BMI correlates negatively with mortality (and remember that this is after we assumed that body fat was a perfect predictor of mortality). This would seem to indicate that obese people are less likely to die than normal people. An “obesity paradox.”
Why does this happen? It happens because when controlling for waist circumference, you are essentially making fat cost less than muscle in your BMI calculations – the same as with E. Honda and Zangief above. In other words, you are counting people who are in better shape as more obese than they really are.
How does this simple thought experiment jibe with the original paper? Pretty well I think.
One thing about the paper is that they actually ran one model where they did not “control” for waist circumference. They did not report finding an “obesity paradox” for that model – which is consistent with my thought experiment. However, they suspiciously did not report any results for that model in the text of the paper -which leads me to suspect that the results did not fit well with their story. [But they did in a Table, see important UPDATE below.] They also found that abdominal circumference was associated with mortality which is consistent with my thought experiment.
So there you go, it seems like people with more muscle relative to fat live longer. Not exactly as counter-intuitive as the study (and press about the study) might make us think.***
I get really mad about bad statistics in medical research. It is one thing to erroneously claim that beautiful people have more daughters. It is not going to literally kill anyone. But medical doctors (most without much statistical training) rely on published medical research to treat patients. When they rely on bad research, it can kill people.
Medical stats people. Am I missing something important here? If not, is this problem worth pointing out in a more formal way? Obviously my thought experiment is simpler than the model in the paper (I consider this a feature) and my dataset is smaller (easily corrected, I think). Send me an email or comment below.
[UPDATE: Thank you for all of the comments thus far, both here and through social media. One of my friends pointed out that Table 2 of the original paper contains the results for the model that did not control for waist circumference that were not reported in the text. He said that this was standard practice in reporting medical research, so it was unfair of me to say this was suspicious.
From the way I read the table normal weight is still associated with higher overall mortality (but in both models not cardiovascular mortality), but difference between normal weight and overweight/obese is much less than in the model adjusting for waist circumference. The confidence interval for normal BMI total mortality does not quite overlap with the mortality for overweight/obese BMI individuals. So outside of something else going on, indications are that controlling for WC may increase the magnitude of the “paradox” but is not the sole explanation.
The table reports the findings in relative risk – which is fairly uninformative. Since the baserate for death in the overweight group was about 1.5%, we are talking about an increased absolute risk of on the order of 0.5-1.5%. Disagreement?]
*- In the Disney movie, Wreck-It-Ralph, Zangief is portrayed as a “bad guy.” However, in the video game he was not a bad guy. He was just Russian. Just because you are Russian doesn’t necessarily mean you are a bad guy.
** – Please note that I don’t want to pick on E. Honda. Despite his size, he is pretty spry. I almost always picked him when challenging my middle school friends (and enemies) at the arcade.
*** – Relatedly, a lot of people tell me that belly fat is an especially bad kind of fat for diabetes. But this oft cited study on the subject does not support that conclusion. It doesn’t compare belly fat to other kinds of fat. In fact, it finds them very highly correlated. What is going on here?
Another possibility:
Some people get diabetes because they are fat.
Some people get diabetes because they have a genetic predisposition, even if they are skinny.
The diabetes caused in skinny people by a genetic predisposition is more likely to lead to complications than the diabetes in fat people caused by being fat.
Is there a paradox here? I don’t think so.
I think you’re misinterpreting the meaning of adjustment here. Adjusting for a variable doesn’t mean you’re “discounting” its effect, but rather it means that you’re averaging your effect across groups which have similar values of that variable.
In your “real data” example, I don’t find your results counter-intuitive at all. Here are two interpretations of the model where you predict body fat from BMI and waist circumference:
#1: For two individuals with the same BMI, the one with the larger waist circumference will have a higher body fat percentage.
Obviously this makes sense; see E. Honda above.
#2: For two individuals with the same waist circumference, the one with the higher BMI will have the lower body fat percentage.
This is a bit trickier, but follows from the same logic as #1; the main mechanism for pushing your BMI higher while maintaining the same waistline is by building muscle (hence decreasing body fat). You can see this effect in action by observing, say, linebackers in the NFL, whose waists are not dramatically larger than the average person but have much higher BMIs and lower body fat because of how muscular they are.
As far as the JAMA article goes, there are a lot of potential reasons why the obesity paradox could be a real thing (Patrick Linehan gives one plausible explanation above, but there might be many reasons why people who get diabetes despite having a normal BMI are somehow “sicker” on average than the diabetic population as a whole).
Patrick and JW. Thank you for your comments. I have a pretty good imagination and can come up with a few post-hoc explanations that could explain the obesity paradox, if it exists. Others have in the web articles I cite. But the first step is establishing that the “paradox” actually exists, otherwise there is no reason to try to explain it.
JW. I understand what adjustment means. I think you misunderstand the purpose of my post. What you wrote for #2 was exactly what I was trying to explain with my post (and why I used the SF2 characters to explain #1). The authors of the paper found that lower BMI is associated with higher mortality. I was showing that you erroneously find this association if you “adjust” for WC, even if the association goes the other way before “adjustment.” This happens for exactly the reason you explain in #2.
Trying to understand what’s going on here, I used the R data shown here and plotted BMI vs. bodyfat – adjustment for waist circumference, that is, brozek – 0.696*abdomen. I don’t know how I could show the plot here, but it clearly shows that the “reversal” of the BMI effect is due to an outlier. That makes me happy, since I didn’t understand from the start the assymmetry between BMI and abdomen effects, except that abdomen seems to be more correlated with body fat, so that when included in the model, the BMI effect may become random.